Unlocking Transformer Secrets: The No-Load Phasor Diagram
Ever wondered how a transformer, that silent workhorse of the electrical world, actually functions? The key to understanding its behavior lies in a visual representation called the no-load phasor diagram. This diagram, a kind of electrical roadmap, reveals the intricate relationship between voltages, currents, and magnetic flux within a transformer when no load is connected to its secondary winding.
The no-load phasor diagram isn't just a theoretical concept; it's a powerful tool for engineers and anyone working with electrical systems. By depicting the interplay of electrical quantities in a transformer's core, it allows us to predict performance, diagnose potential issues, and optimize efficiency. Imagine trying to navigate a city without a map – similarly, understanding transformer behavior without a phasor diagram can be a daunting task.
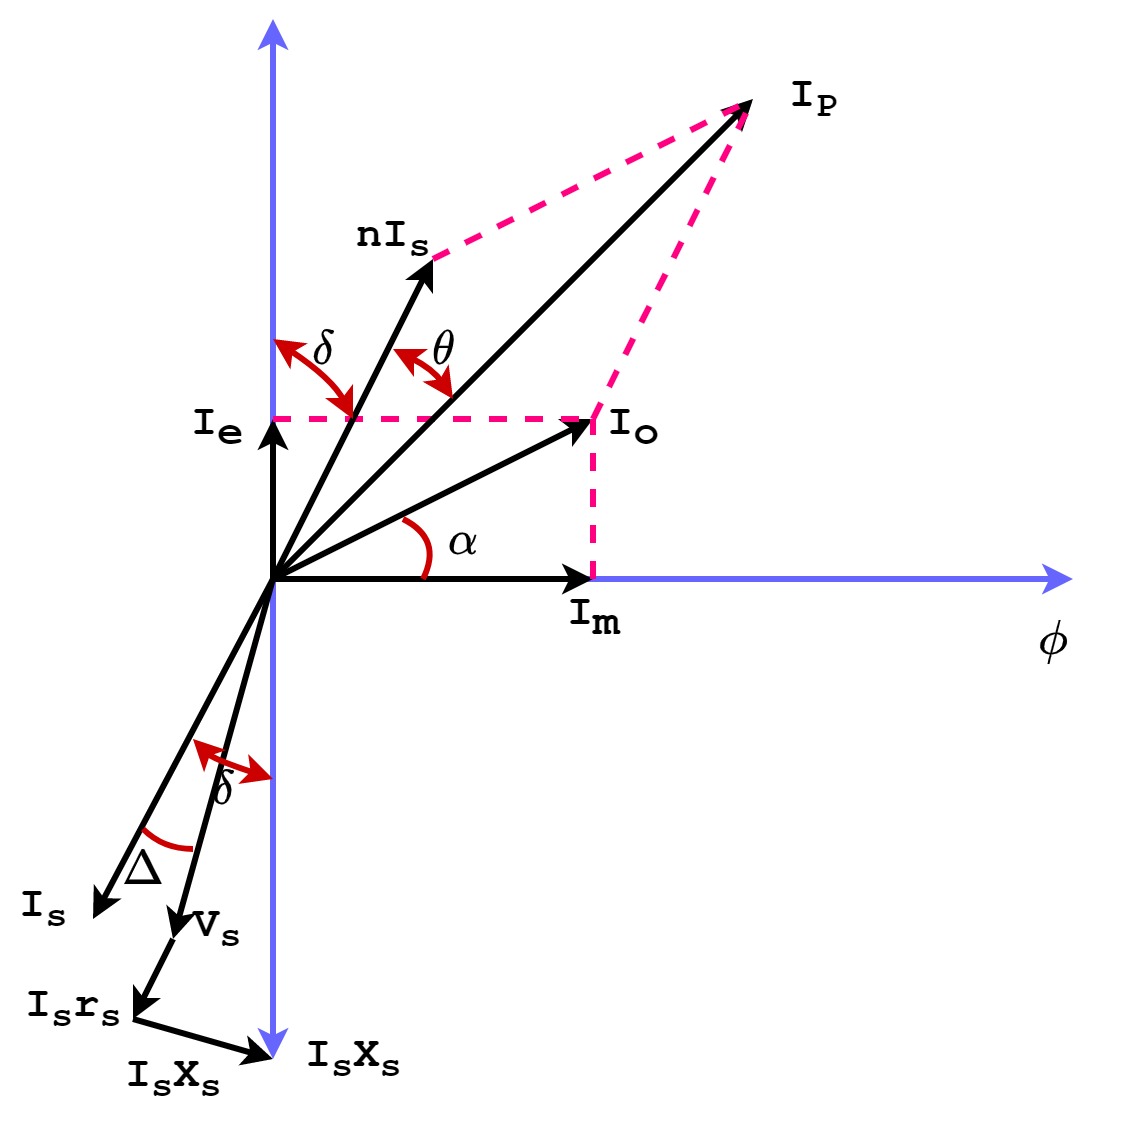
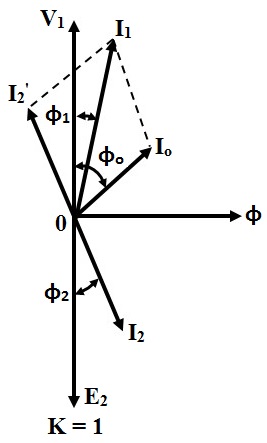
Let's delve into the heart of this diagram. When a transformer's primary winding is energized but the secondary winding is open, a small current, called the no-load current, flows. This current is crucial because it establishes the magnetic flux within the transformer's core. The no-load phasor diagram visually represents this current and its relationship with other key parameters like the applied voltage and the induced electromotive force (EMF).
Historically, the development of the phasor diagram goes hand-in-hand with the advancements in alternating current (AC) theory. As engineers grappled with the complexities of AC circuits, the need for a visual tool to represent these sinusoidal quantities became apparent. The phasor diagram emerged as an elegant solution, enabling a clearer understanding of AC circuit behavior, including transformers. This diagram's importance lies in its ability to simplify complex relationships, allowing us to analyze and predict transformer performance under different conditions.
Now, let's explore the core components of a no-load phasor diagram. The applied voltage to the primary winding is typically represented along the horizontal axis. The no-load current, being significantly smaller than the full-load current, is represented by a phasor at a certain angle to the voltage phasor. This angle reflects the power factor of the no-load current, which is primarily determined by the core losses of the transformer (hysteresis and eddy current losses). The magnetizing component of the no-load current is responsible for establishing the magnetic flux. A phasor representing the induced EMF is also included, usually opposite in direction to the applied voltage.
Understanding the transformer no-load phasor vector representation is essential for predicting its behavior under various conditions. A fundamental issue related to this diagram is accurately accounting for the core losses, as these losses directly impact the no-load current and the efficiency of the transformer.
A key benefit of using the no-load phasor diagram is determining the core losses. By analyzing the magnitude and angle of the no-load current, we can accurately estimate the hysteresis and eddy current losses within the transformer core. Another benefit is understanding the magnetizing current requirement. This allows for proper design and selection of the core material and windings. Furthermore, the diagram helps in predicting the no-load voltage regulation, which is the change in secondary voltage from no-load to full-load conditions.
Advantages and Disadvantages of Using No-Load Phasor Diagrams
| Advantages | Disadvantages |
|---|---|
| Simplifies complex AC relationships | Requires understanding of phasor concepts |
| Visually represents core losses | May oversimplify real-world transformer behavior |
| Aids in transformer design and selection | Doesn't account for load conditions |
One real-world example involves using the no-load phasor diagram to determine the core losses in a distribution transformer. By measuring the no-load current and its phase angle, engineers can accurately estimate the core losses and implement measures to improve efficiency.
A common challenge in interpreting no-load phasor diagrams is accounting for the non-linear behavior of the core material. Solutions include using more sophisticated models and advanced simulation software to accurately capture these non-linearities.
FAQ:
1. What is a phasor diagram? A: A visual representation of sinusoidal quantities in an AC circuit.
2. Why is the no-load current important? A: It establishes the magnetic flux in the transformer core.
3. What are core losses? A: Losses due to hysteresis and eddy currents in the core.
4. How does the no-load phasor diagram help in transformer design? A: It helps determine the magnetizing current and core losses.
5. What is no-load voltage regulation? A: The change in secondary voltage from no-load to full-load conditions.
6. How is the no-load current measured? A: Using specialized instruments like ammeters and wattmeters.
7. What is the significance of the angle between the voltage and current phasors? A: It represents the power factor.
8. How can non-linear core behavior be accounted for in the phasor diagram? A: By using advanced models and simulation software.
A helpful tip for understanding the no-load phasor diagram is to remember that the magnetizing current lags the applied voltage, while the core loss current is in phase with the voltage.
In conclusion, the no-load phasor diagram of a transformer is a fundamental tool for understanding its operation. From aiding in efficient design and selection to predicting performance and diagnosing potential issues, this visual representation provides invaluable insights into the transformer's behavior. Mastering the interpretation of this diagram is essential for anyone working with electrical power systems. By understanding the intricacies of the no-load phasor diagram, engineers can optimize transformer efficiency, reduce losses, and ensure reliable power delivery. This knowledge empowers us to harness the full potential of these essential electrical machines and build a more sustainable and efficient energy future. Dive deeper into the world of transformers and explore the fascinating interplay of electrical quantities within their core – the no-load phasor diagram is your key to unlocking their secrets.

Circuit Diagram Of Single Phase Transformer | YonathAn-Avis Hai

Ideal transformer and its phasor diagram | YonathAn-Avis Hai

Phasor Diagram Of Transformer On Lagging Load | YonathAn-Avis Hai

How To Draw A Phasor Diagram Physics | YonathAn-Avis Hai

Theory of Transformer on Load and No Load Operation | YonathAn-Avis Hai

Transformer on NO Load Condition | YonathAn-Avis Hai

Phasor Diagram Of Transformer On Load | YonathAn-Avis Hai

No load Transformer and its phasor diagram | YonathAn-Avis Hai

Phasor Diagram Of Transformer Equivalent Circuit | YonathAn-Avis Hai
Phasor Diagram Of Single Phase Transformer | YonathAn-Avis Hai

No load Transformer and its phasor diagram | YonathAn-Avis Hai

Transformer Nameplate Phasor Diagram | YonathAn-Avis Hai

Equivalent Circuit Of A Single Phase Transformer | YonathAn-Avis Hai

Transformer ON Load Condition | YonathAn-Avis Hai

Phasor Diagram Of Transformer On Load | YonathAn-Avis Hai